
Turtle Lake Lakeshore and Watershed Management Study
Turtle Lake is a valued place for recreation, nature, and community life. To protect the lake’s health and guide responsible use and future development opportunities, a new Lakeshore and Watershed Management Study is being conducted.
This study is led by a team of professional planners and scientists, and is being overseen by the Turtle Lake Study Steering Committee, which includes local community contributors.
- NEW Boating Capacity Report
- Posters and Story Map
- Video explainer
- Purpose of the Study
- Why this Study Matters
- Water Quality
- Boating Capacity
- Shoreland Capability
- Angling Capacity and Fishery Health
- Study Workplan and Timing
- Survey
- Participatory Mapping
- Feedback on Land Use Maps
- Turtle Lake Study in the Media
- The Study Team

Information Café posters
See the posters used at the Information Café (Aug. 10th @ Livelong Community Hall).
Story Map
See the Story Map - view the map as local people add to the story of Turtle Lake.
Watch our video explainer
Purpose of the Study
- Monitor the health of Turtle Lake using advanced scientific testing.
- Gather knowledge from local people – both permanent and seasonal residents.
- Provide clear guidance for future development and environmental protection.
- Support municipalities and other partners in updating policies and bylaws.
Why this Study Matters
The study aims to ensure Turtle Lake remains a vibrant, healthy ecosystem that supports recreation, wildlife, and responsible development. We're updating past work with updated data and broader community input.
This study will provide up-to-date information about:
- Land use and development patterns;
- Water quality and lake health;
- Shoreline and watershed conditions;
- Recreational use and lake access; and
- Community priorities and concerns.


What We Know From Past Studies
Water Quality
Observed Trend Since 1984:
The 1984 study raised serious concerns that further shoreline development could degrade water quality through increased nutrient loading and insufficient wastewater management.
Since then, water quality has remained a central issue.
Scientific monitoring has shown that while the lake still supports recreation, signs of nutrient enrichment (e.g., algal blooms and elevated coliform counts) have persisted or increased in certain areas—particularly during peak summer use.
Long-term data shows gradual decline in some water quality indicators, especially in more developed southern areas.
Summary of 2016 Water Quality Testing Results
Boating Capacity
See the report summarizing the boating field study and capacity analysis.
Read the studyObserved Trend Since 1984:
In 1984, boating activity was highlighted as a threat to environmental conditions on the lake.
From 1993 to 2016, the number of boats on the lake grew substantially.
The south part of the lake experiences periods where there are too many boats, jeopardizing safety.
The whole lake still has enough space for boats, but if more cabins and docks are added without careful planning, the area of overcrowding could spread.
Recreational demand was strong in 1984 and has grown substantially since, with higher year-round visitation, increased motorized use, and more pressure on public beaches, parks, and boat launches.
Conflicts among user groups (e.g., paddlers vs. powerboats, swimmers vs. anglers) that were identified in the original study have become more common, highlighting the need for managed recreation zones and infrastructure upgrades.
Prior studies have not validated boating capacity assessments with on-water counts.
Summary of Historic Boating Capacity Assessment Results:
1993 Assessment
Boating capacity for the southern basin was estimated at 600 ha, accommodating between 75 to 150 boats depending on activity density.
Existing boat count was estimated at 792, with peak use estimated at 198 boats—already exceeding safe boating capacity at that time.
It was projected that if all subdivided lots were developed, peak use could rise to 364 boats, or 2.5 to 5 times the safe boating capacity.
2016 Assessment
The net available boating area in the southern basin was updated to approximately 1,015 ha.
Using detailed boat inventory data collected cabin-by-cabin, the actual peak demand from southern shore developments was estimated at 1,435 ha, exceeding the available boating area by over 40%.
At full build-out, required area would increase to 1,897 ha, nearly double the available space.
These findings were based on an updated inventory and estimation method considering boat types, density assumptions (4–8 ha per boat), and spatial exclusions (shoreline buffer zones, shallow areas, etc.).
What It Means
Together, these studies show:
- A continued and measurable increase in boat ownership and usage.
- The southern basin has consistently been under pressure, with both studies concluding that safe boating capacity is being exceeded during peak times, especially with projected build-outs.
Shoreland Capability
Observed Trend Since 1984:
The 1984 study concluded that lake shore development had likely reached its maximum sustainable limit, and called for coordinated management to prevent environmental degradation.
Since then, shoreline development has grown by over 5 km (from 14.5 km in 1984 to 19.8 km in 2025), increasing the developed shoreline share from ~25% to 34%.
Beginning in 1993, successive Turtle Lake studies have assessed the capability of land for development (how good the land is for cabins or cottages) using five things: slope, soil type, drainage, plant life, and fish habitat along the shore.
From 1992 to 2016, cabin numbers increased by 42% (from 1,000 to 1,419), with a slowdown in subdivision activity post-2003 likely due to the introduction of limits into municipal policy.
In 1993, about 28% of the total undeveloped shoreline (approximately 16 kms) was considered developable.
In 2004, about 7% of the undeveloped shoreline was rated as high capability for development.
By 2016, the shoreline rated with high capability for development dropped slightly to 4.4% due to additional development.
There was no change to the method used to classify shoreline – the Thomas (1983) framework. Here’s how it worked:
- Each shore area was studied — The land near the lake (within about 100 metres of the shore) was divided into sections.
- Each section was scored — For every section, they gave scores based on how steep the land was, how good the soil was, how well water drained, how much plant life there was, and whether the shoreline was important for fish or nature.
- The scores were added up — When all the scores were added together, it showed how easy or hard it would be to build cabins in that area.
- The land was put into four groups:
- Class A (High Capability): Great for building. Easy to use. Not many problems.
- Class B (Moderate Capability): Okay for building, but needs more care.
- Class C (Low Capability): Hard to build on. Needs special planning.
- Class D (Very Low Capability): Not good for building. Should be protected or avoided.
- The summary of the 2016 Development Capacity Assessment results were mapped. All the land around the lake was color-coded based on its class, so it was clear where development would be safest and most responsible.

This helped communities and decision-makers see where future cabins or developments could go without harming nature or causing problems.
Summary of Development Capacity Assessment Results:
1993 Assessment
Land Around the Lake
- In 1993, the study said that about 16 kilometers of shoreline at Turtle Lake looked like it could be used for more cabins or other buildings.
- This was about one-quarter of the whole shoreline.
- The study was based on looking at the land, not on detailed measurements or maps like newer studies used.
What They Noticed
- Most of the land around the lake was already privately owned, so that wasn’t seen as a problem for new development.
- The land itself (like the soil and slope) looked okay in many places for building, but the study also said that many people living at the lake thought there was already enough development.
Advice to Decision-Makers
- Even though the land might be good for building, the study said other things were more important to consider:
- Too many boats, especially in the south part of the lake.
- Too much fishing that could hurt fish populations.
- Crowded public beaches, especially at Horseshoe Bay.
2016 Assessment
Land Around the Lake
- In 2016, the study used a detailed method to check how good each part of the shoreline was for building cabins.
They looked at five things:
- How steep the land is (slope)
- What kind of soil it has
- How well water drains from it
- How much plant life is there
- If the shoreline is important for fish and nature
What They Noticed
- Only 4% of the undeveloped shoreline was in Class A (the best).
- Over 50% was in Class C (poor) or D (very poor), which means it's hard or unsafe to build on.
- Most of the remaining land was Class B, which is okay if done carefully.
Advice to Decision-Makers
- There is not much good land left around the lake for more cabins.
- If people want to build more, it needs to be planned very carefully.
- Some land is just not suitable and should be protected instead of developed.
What It Means
Together, these studies show:
- In 1993, it seemed like there was room to grow, but people were starting to worry.
- By 2016, the science showed that only a little bit of good land was left.
- The lake is under more pressure from boats and cabins.
- Without careful planning, more building could make the lake too busy, which could harm the water, wildlife, and people’s enjoyment.
Angling Capacity and Fishery Health
Observed Trend Since 1984:
The 1984 study found that fishing success—especially for northern pike—was already going down, likely due to too much pressure on fish populations.
Fishing has improved since 1993, thanks to good stocking programs and better care for the lake.
With more cabins and people, the lake is still under pressure. Building near the shore and removing plants has harmed places where fish lay their eggs.It’s very important to protect the shallow water near the shore to help fish stay healthy.
Summary of 2016 Fishing and Fish Health Results:
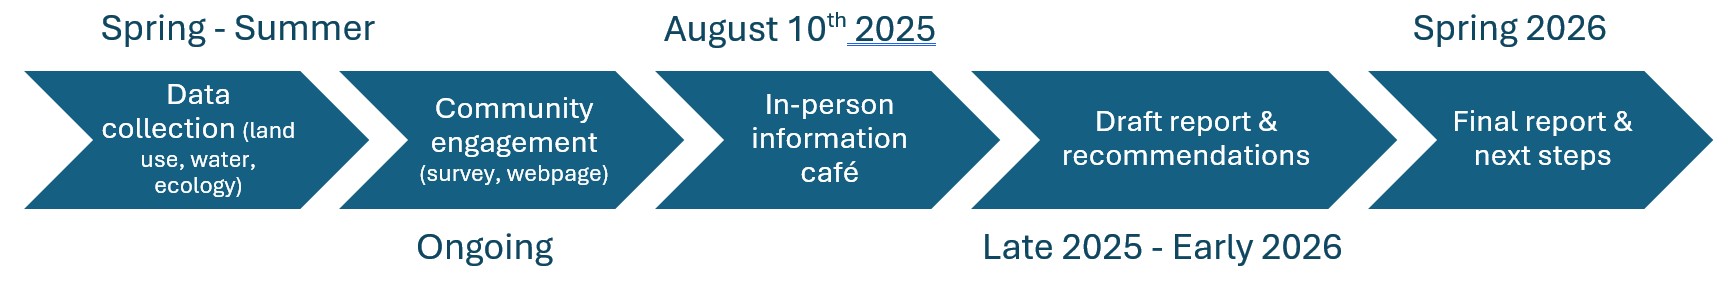
Study Workplan and Timing
Our study follows a seasonal timeline. Fieldwork will happen over the spring and summer, with water quality, boat counts, shoreline assessments, and community input collected. A draft report is planned for the fall, and final recommendations early next year
Survey
Share your knowledge of Turtle Lake by taking our anonymous survey. Taking about 4 minutes to complete, we value your observations about water use, recreation, and changes over time. The survey will remain open until the end of August and complements data being gathered by scientists throughout the summer.
Participatory Mapping
Help identify local environmental features, recreational hot-spots, or areas of concern by using our interactive map. Share what you know to help inform future planning recommendations and priorities.
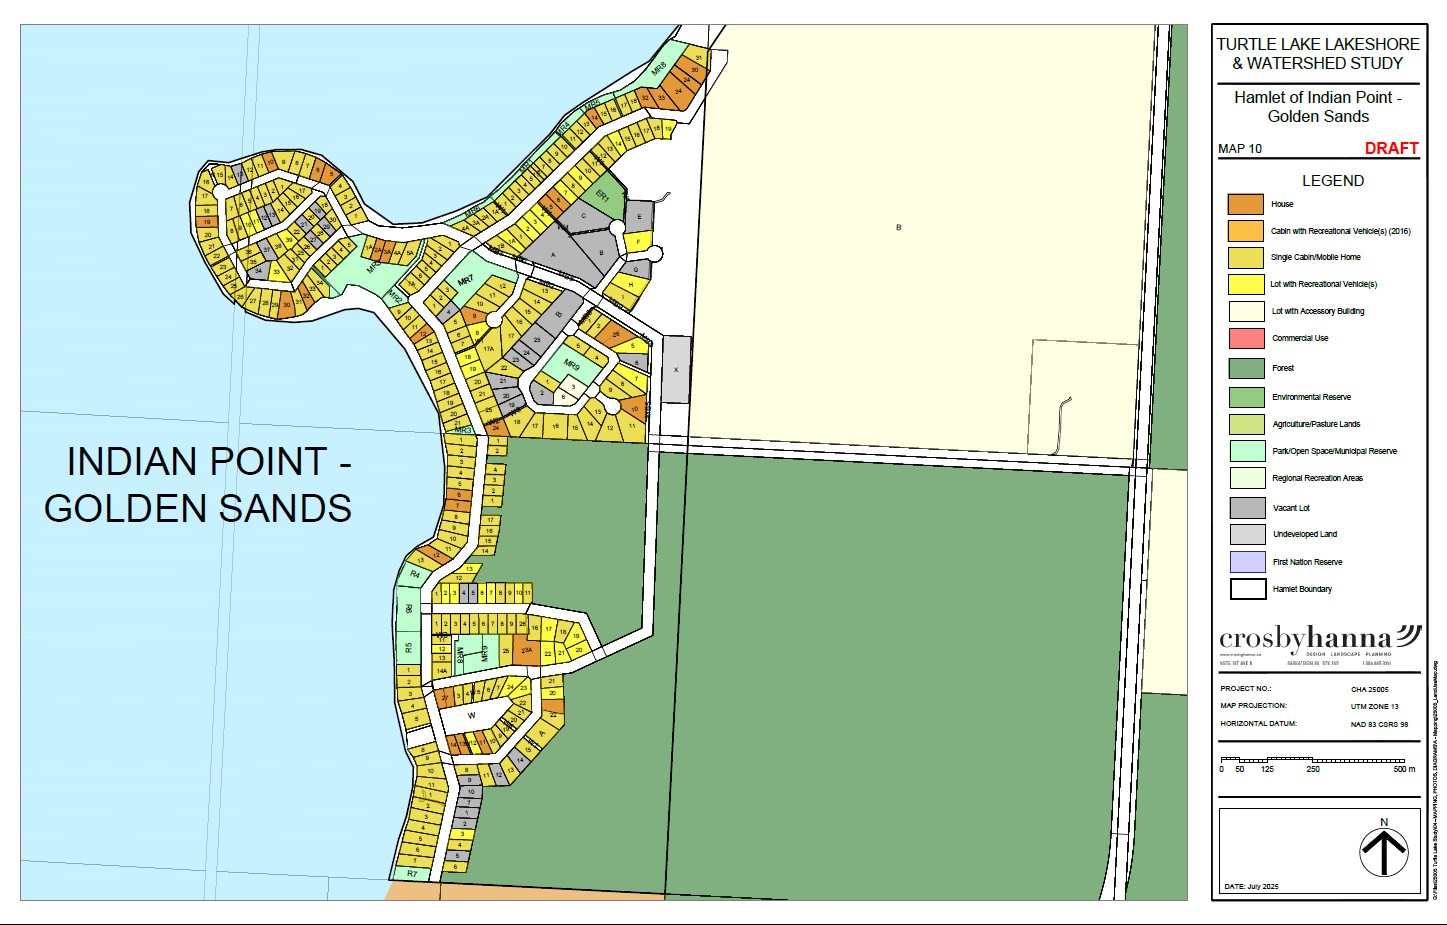
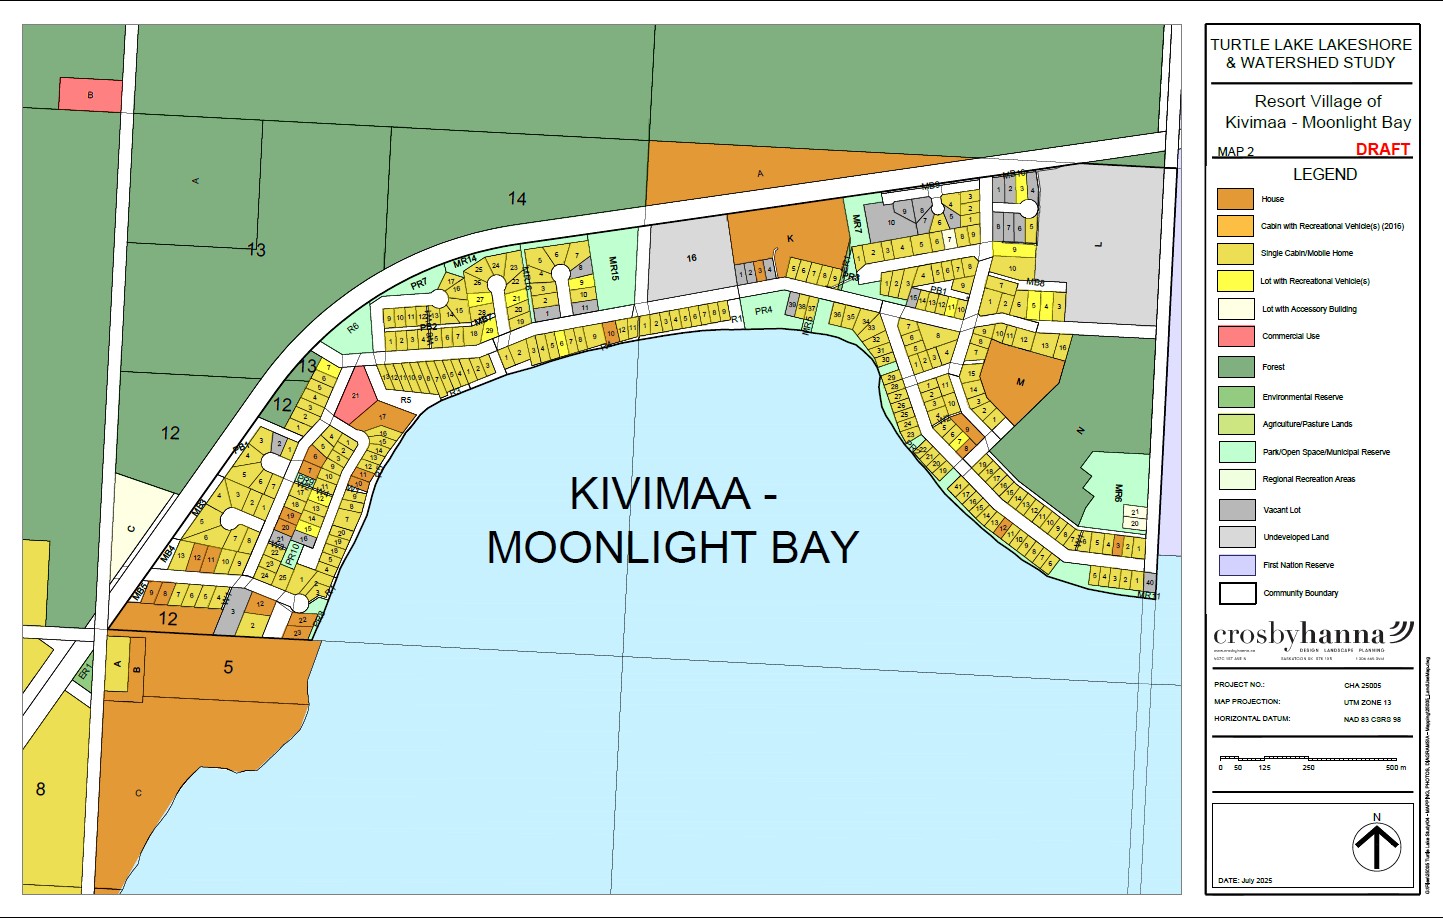
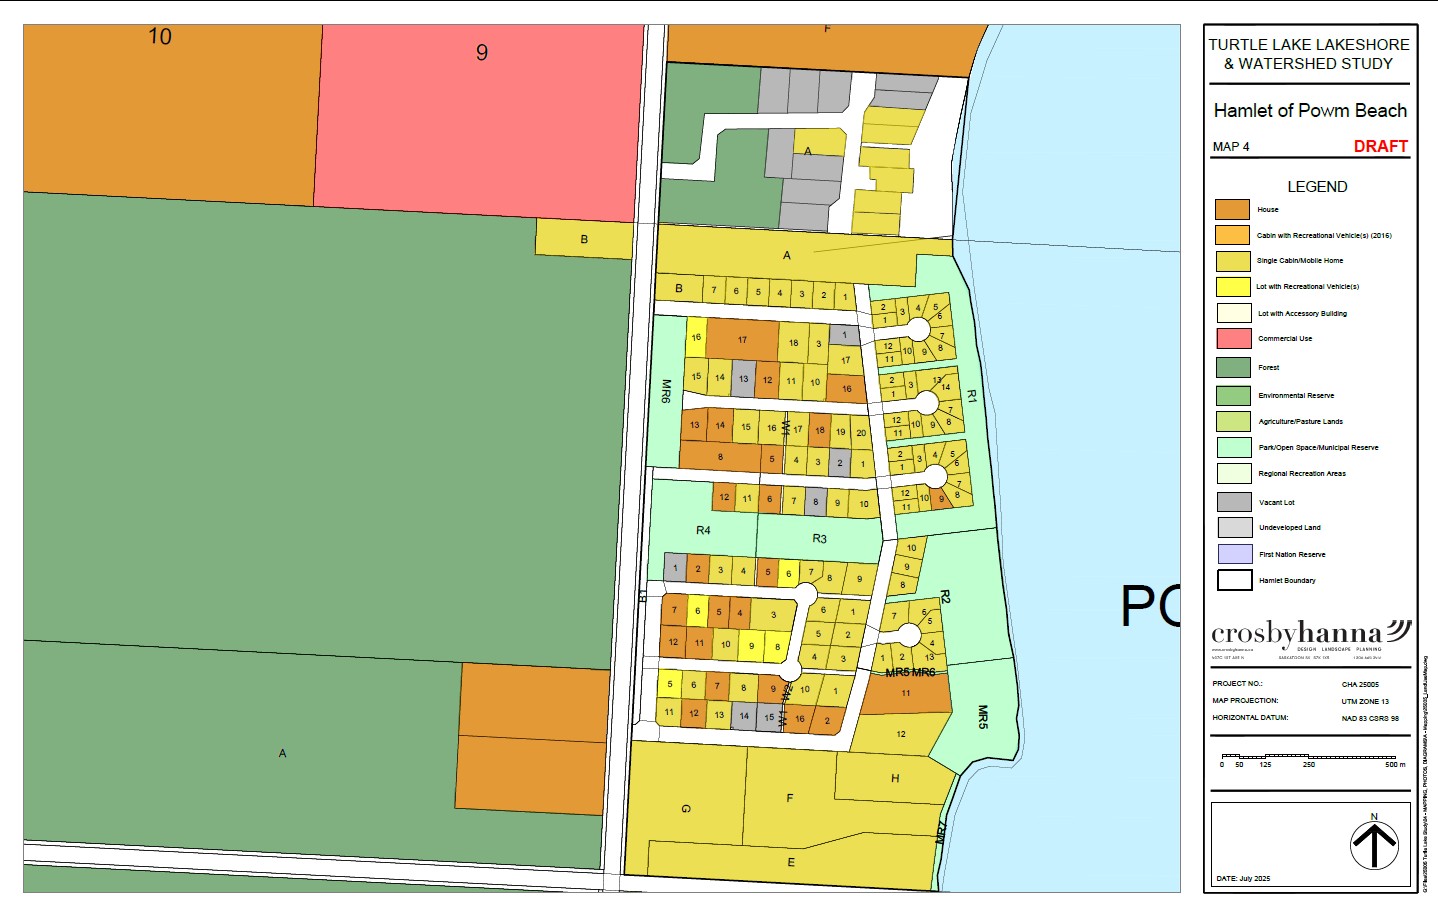
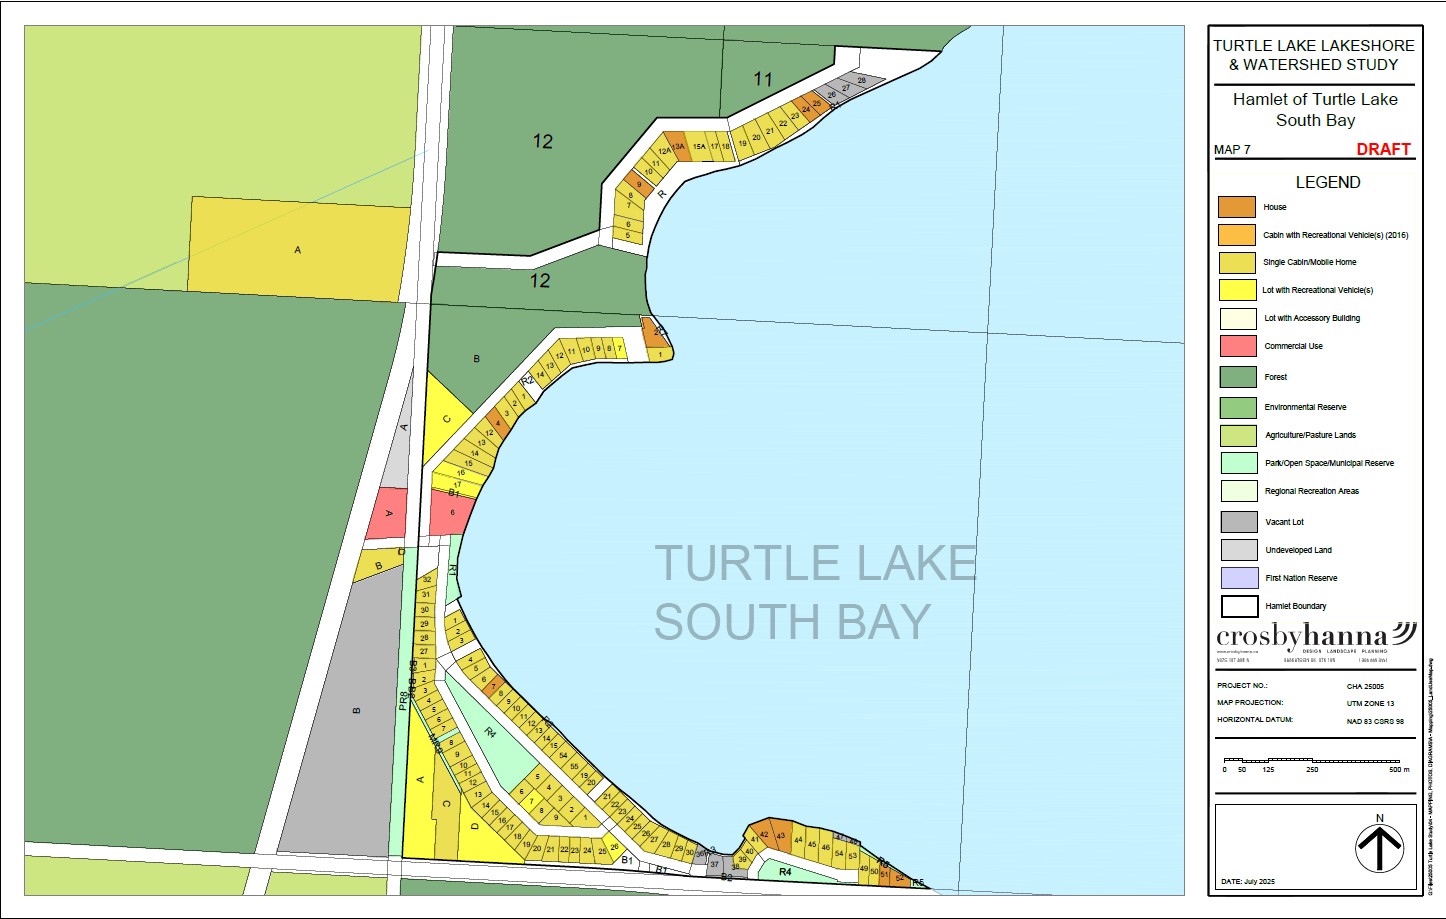
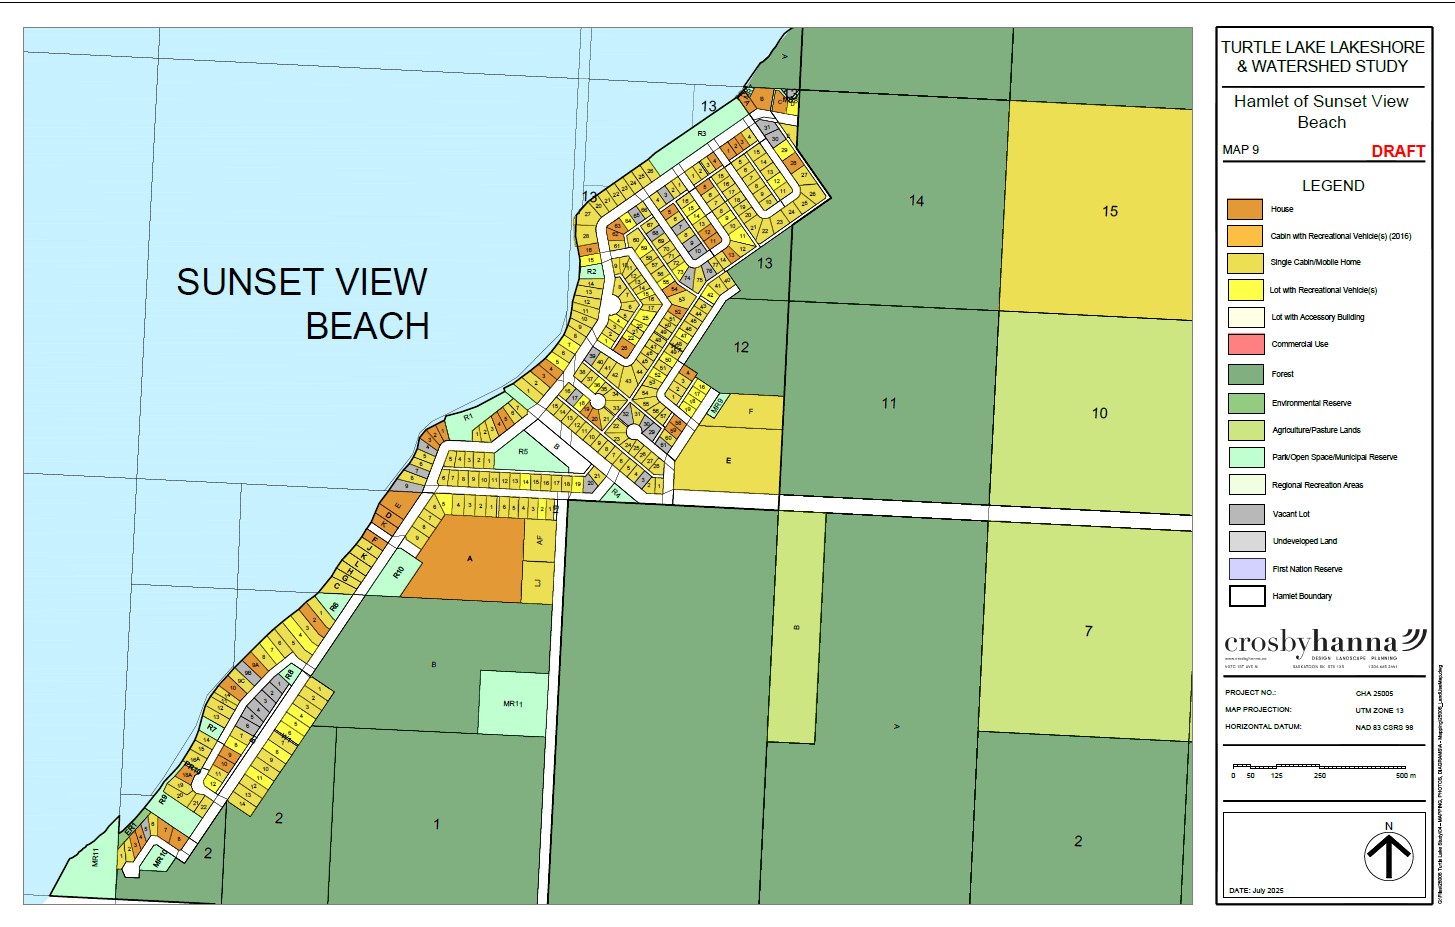
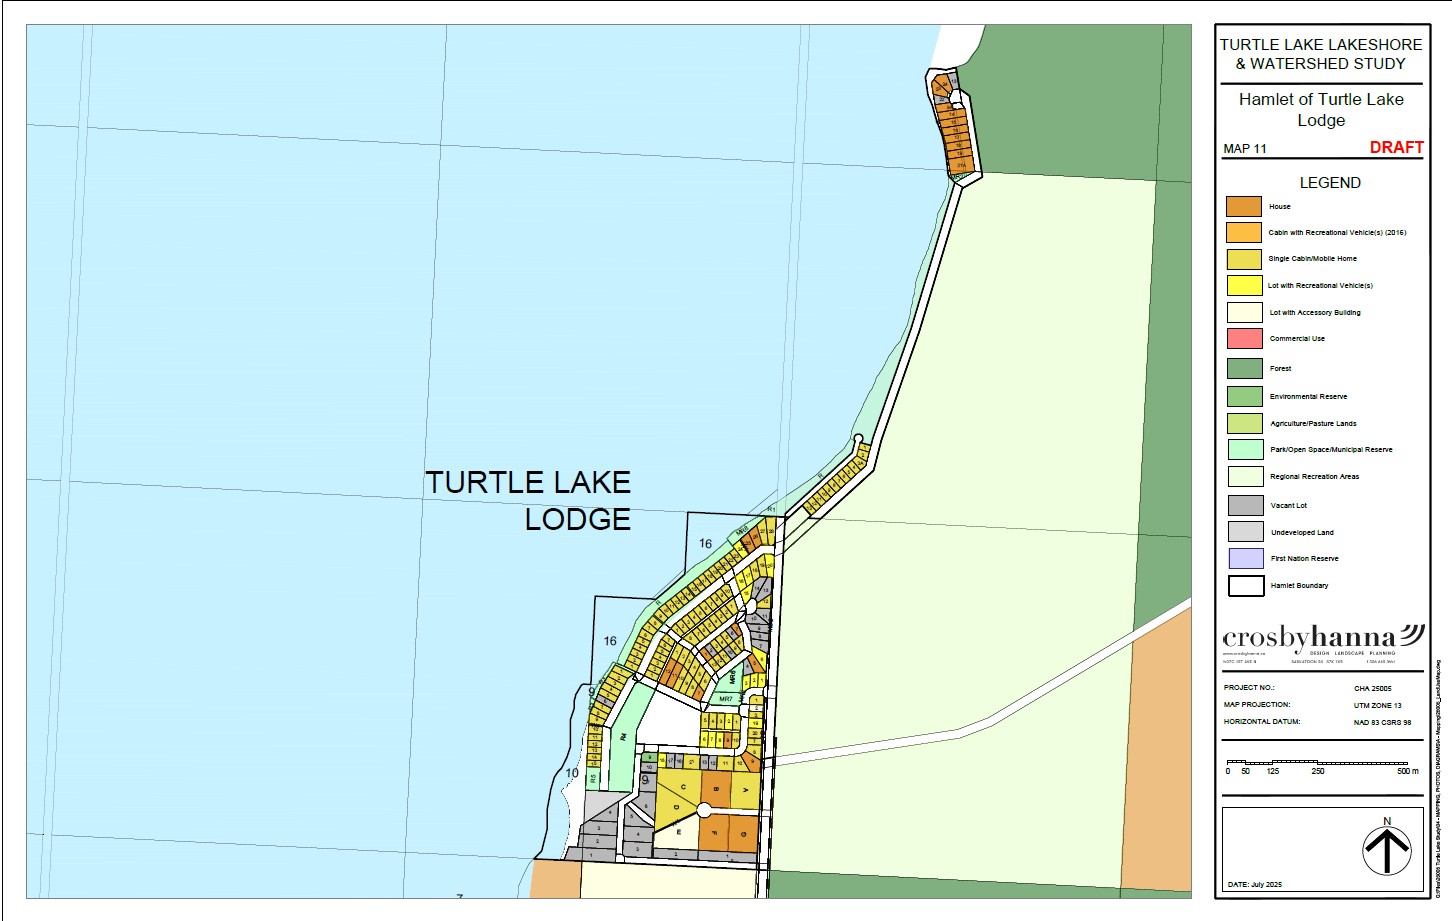
Feedback on Land Use Maps
Help us make these maps as accurate as possible. Email your comments and corrections to planning@wallaceinsights.com


Turtle Lake Study in the Media
- CJME/650CKOM Story - Algae blooms, development concerns at Turtle Lake prompt call for input
- BattlefordsNOW Story - Public Input for Study on Lake Conditions and Development Pressures for Turtle Lake
- CJWW Story - “There is a real need to have a coordinated effort to make sure there aren’t unintended consequences”: Turtle Lake study seeks community input
- CBC Morning Story - Locals can help monitor the health of Turtle Lake
The Study Team
Turtle Lake Steering Committee

.jpg)


Project Consulting Team


